Objects
An object (in other systems an "RSO" or "Resident Space Object") represents a satellite orbiting earth.
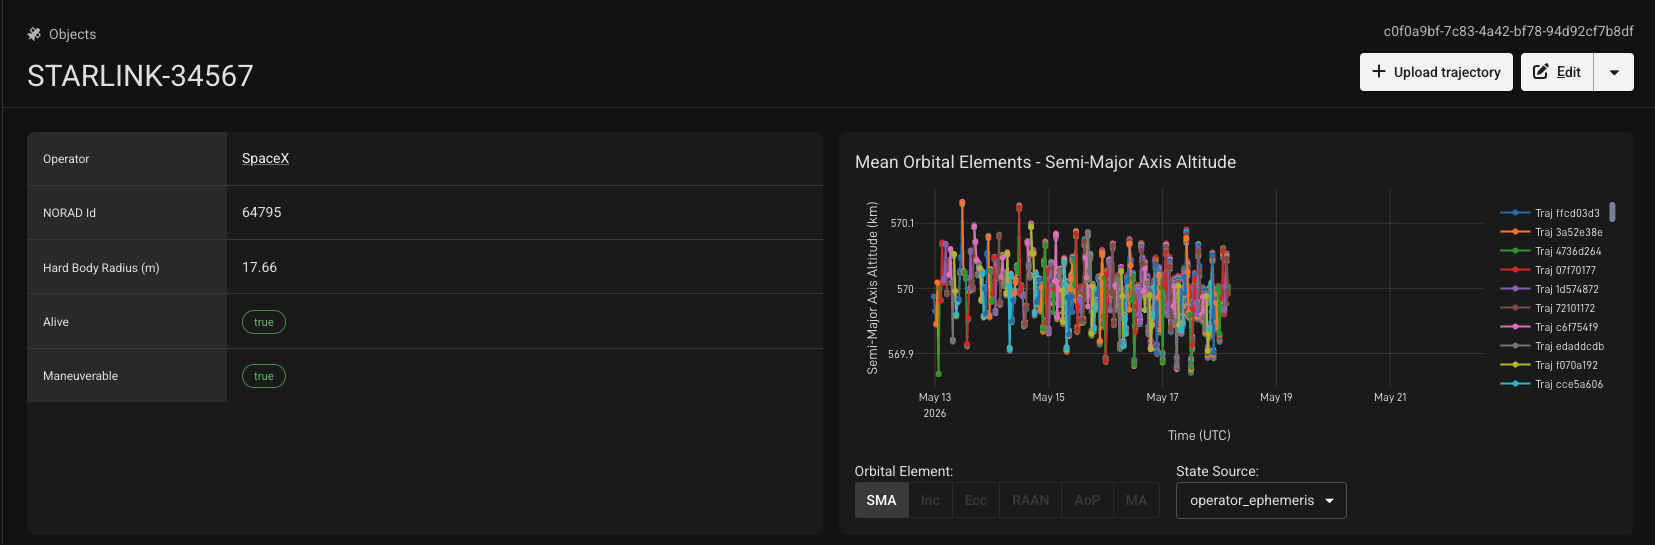
Objects have the following properties, visible on the object details page:
- A human-readable name.
- (optional) NORAD ID, for cross-referencing with other catalogs.
- Maneuverability status (true or false)
- Aliveness (true or false)
- Hard-body radius, measured in meters, used for calculating probability of collision.
Creating and Modifying Objects
Objects are owned by a single "Operator" account. Only users or API keys associated with that operator (and with sufficient permissions) may modify the object.
- Via the Web UI: Users with permissions to manage objects may use the "Edit" button in the object details page.
- Via the API: An API key with the required permission can use the
POST /api/v1/objectandPUT /api/v1/objectendpoints to create new objects associated with their account, or update the properties of their existing objects respectively.
NORAD IDs
A NORAD ID is useful for cross-referencing with the space-track.org catalog. Prior to launch, operators may coordinate with the US Space Force to acquire a "UCN ID" (9-digit number starting with 799...). In these cases, that number may be used in early mission, otherwise, you may keep it as NULL.
Once the item is assigned a permanent NORAD ID, it can but updated with the PUT /api/v1/object API. If you have a space-track.org account and would like us to automatically sync your object information from there, let us know.
Orbital Elements Plots
The object details page contains plot displaying the calculated mean orbital elements for every trajectory submitted for an object, overlaid on top of each other. This provides an at-a-glance view of the object's orbit. It also provides a quick view of the consistency of subsequent ephemeris uploads.
Upcoming Conjunctions
The object details page also shows upcoming conjunctions for an object:
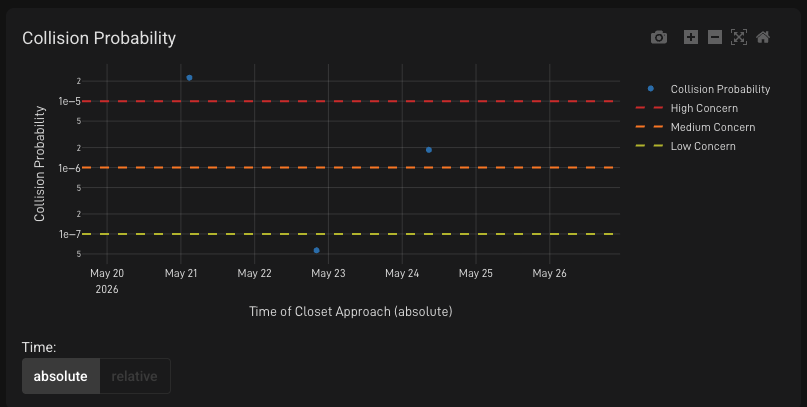
This is a graphical representation of the Events table below, plotting the probability of collision (Pc) against the time until the close approach. For this plot and the below table, we will display the largest Pc among active CDMs for that event (i.e., if there is both a CDM based on a spacex_optical Stargaze trajectory, and a CDM from an operator-submitted operator_ephemeris trajectory, we will display the larger of the two)
Note that if you do not supply covariance, the system will not calculate a collision probability for your trajectories, and you will not see data on this plot.
Prediction Accuracy
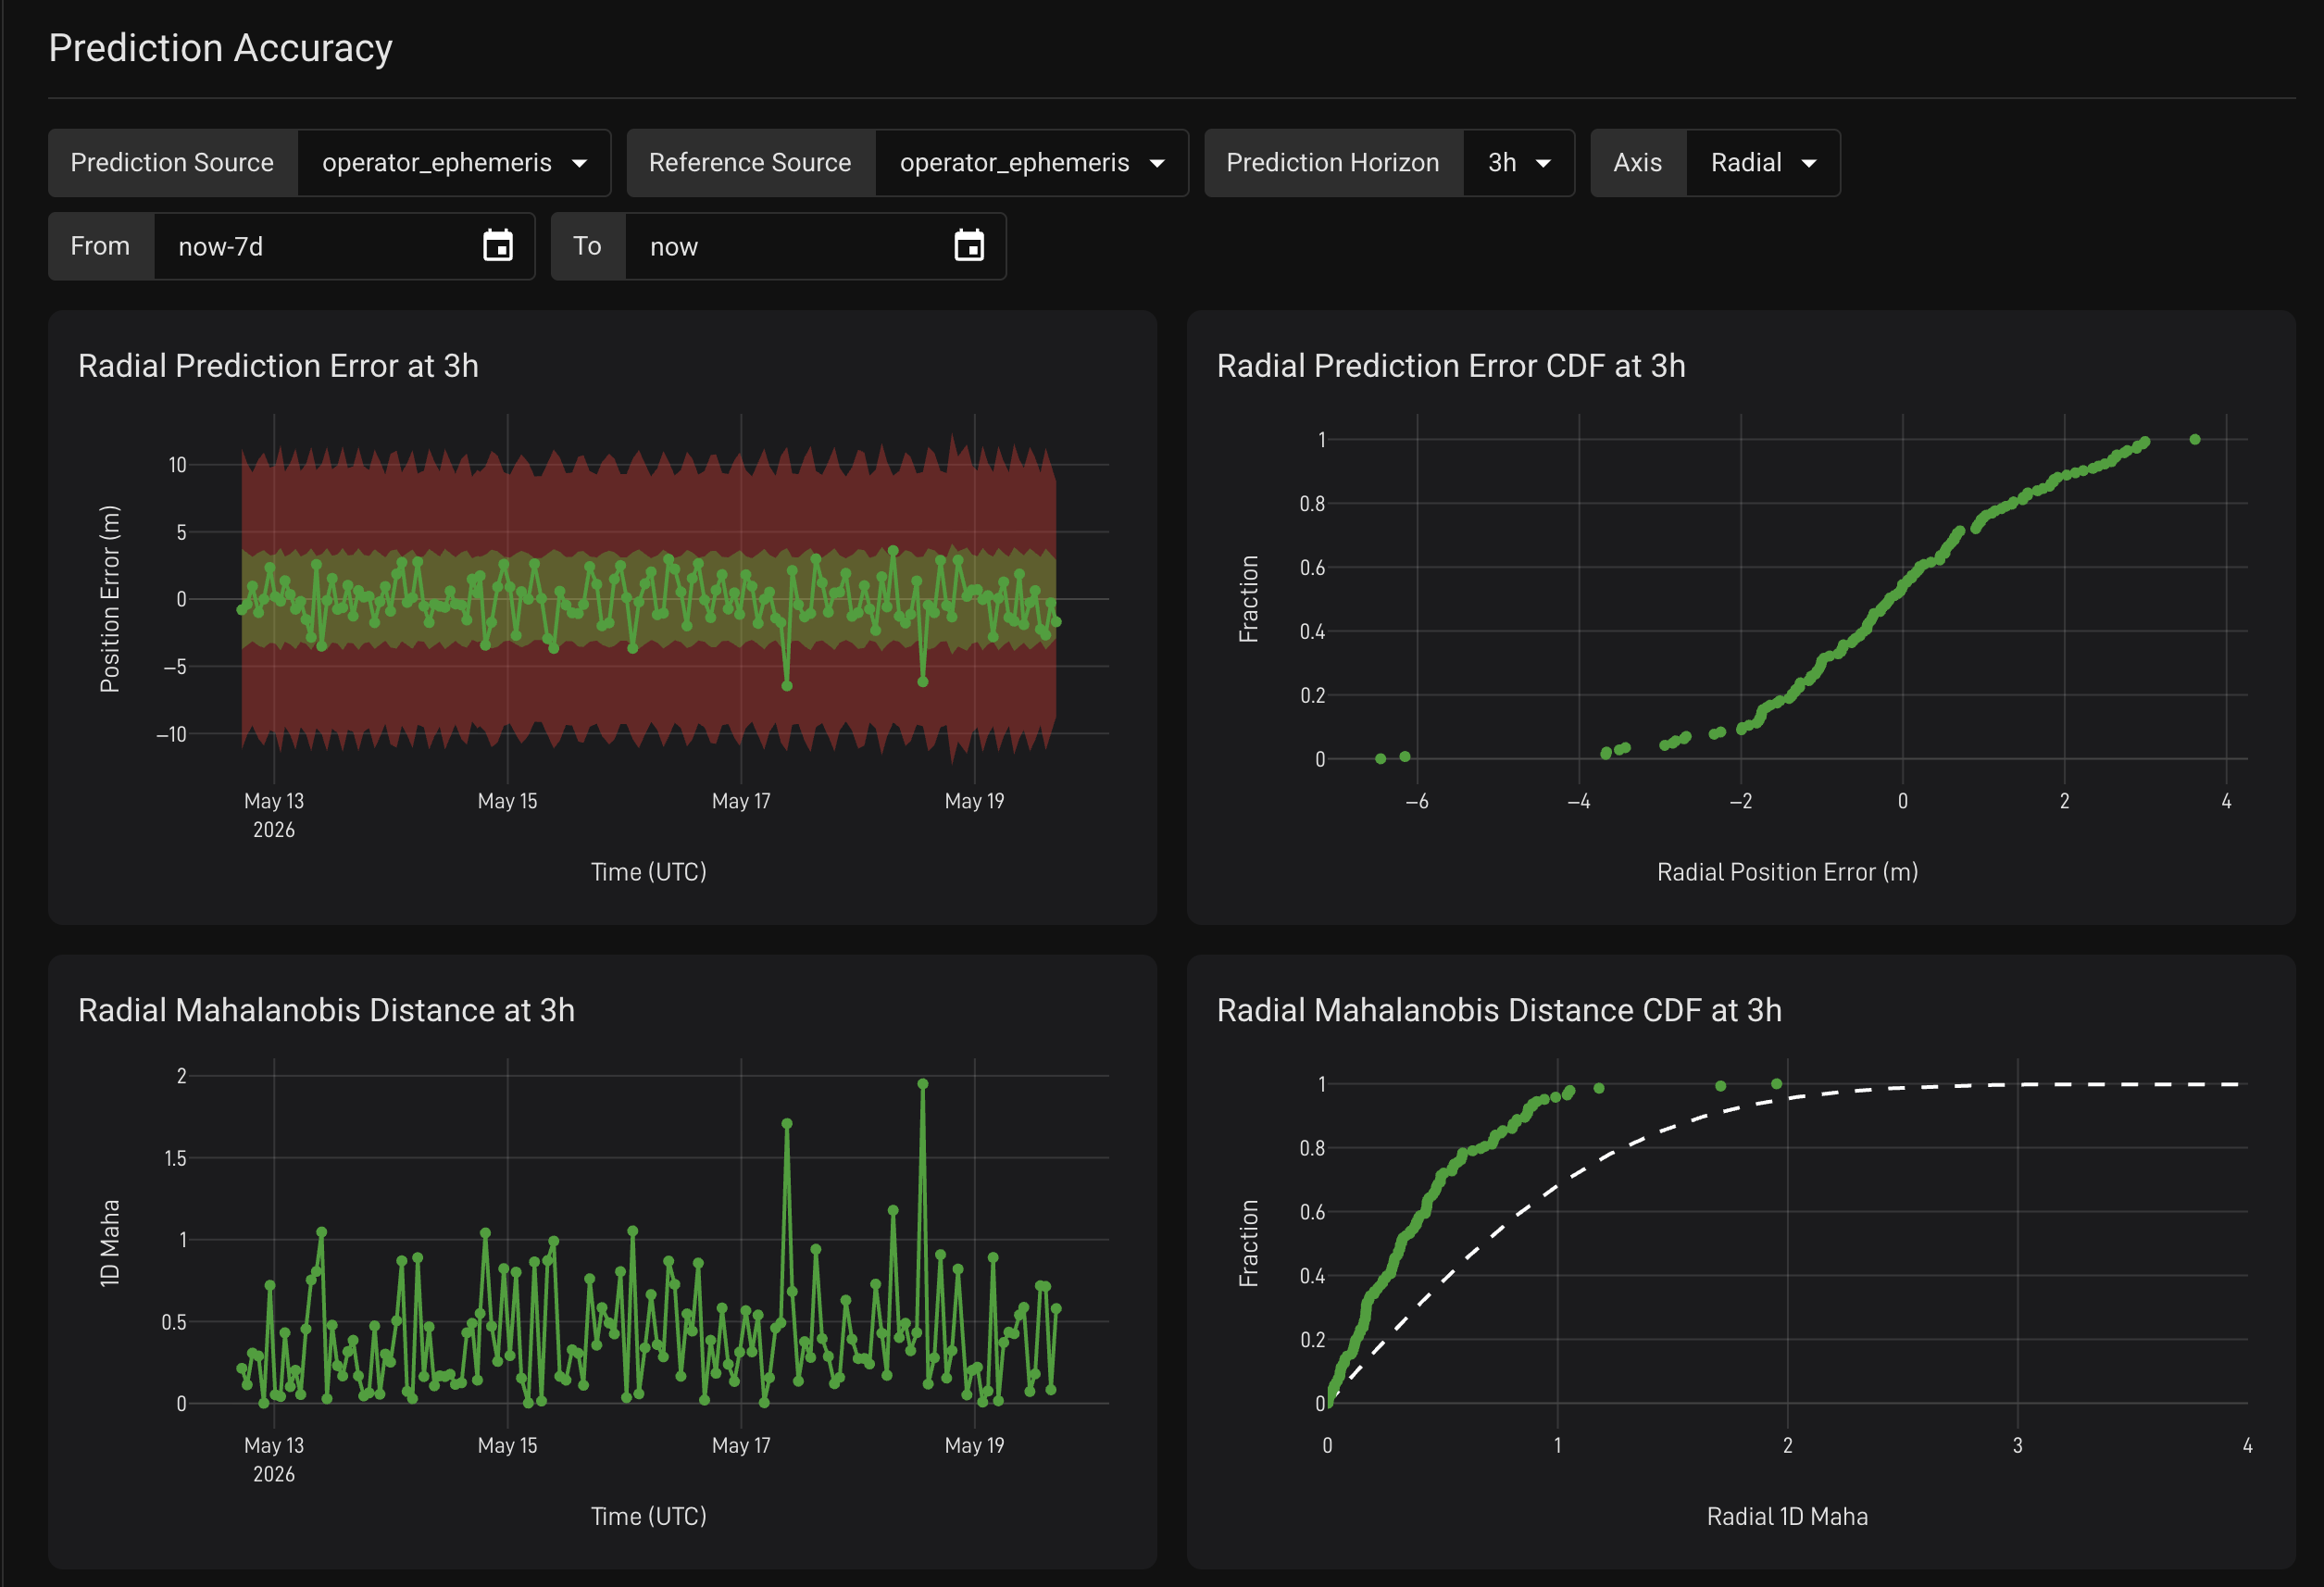
Below the orbital elements plots are plots describing the accuracy of trajectory submissions:
Methodology
When trajectories for a given object are submitted to the Space Safety Platform, it produces "reference states", a series of interpolated state vectors. Subsequent trajectory uploads will overwrite old reference states, so the series of reference states represents the predicted state of an object according to the most recently-submitted trajectory spanning that time.
Prior predictions can then be evaluated against those reference states to evaluate the consistency of an object's ephemeris submissions.
Filters
The plots provide the following drop-down options:
| Filter | Meaning |
|---|---|
| Prediction Source | The trajectory state source to evaluate |
| Reference Source | The trajectory state source to use as a reference, or "truth" source |
| Prediction Horizon | Duration into the Prediction Source trajectories to evaluate. For example, setting this to 24h means "evaluate the error of the predicted trajectories against the reference states 24h into the trajectory" |
| Axis | Each of these plots represents one dimensional error across an axis in the RTN (Radial, Transverse, Normal) reference frame. This selects which dimension to evaluate |
| From / To | Time range to pull predicted trajectories from |
Setting "Prediction Source" and "Reference Source" to the same value will evaluate a state source's self-consistency. Setting them to different values will evaluate the cross-consistency of two different data sources.
Plots
Prediction Error: This plot shows the 1-dimensional absolute error (vs. the reference state) of trajectories over the time range. The green and red bands show the trajectory's reported 1-sigma and 3-sigma covariances.
Prediction Error CDF: This plot shows a CDF (Cumulative Distribution Function) of the position error. An ideal plot is centered at zero, otherwise, this indicates a bias in the error.
Mahalanobis distance: For trajectories that include covariance, this plot shows the 1-dimensional Mahalanobis Distance, showing where the Reference State falls in the probability distribution of the Predicted State.
Mahalanobis Distance CDF: This plot shows the distribution of the Mahalanobis distances for each trajectory. This is plotted against a Chi-squared distribution with k=1. Points above that line indicate covariance is too large, and predictions are overestimating uncertainty. Points below that line indicate covariance is too small and predictions are underestimating uncertainty.
There are many good public resources on evaluating and tuning covariance realism in orbit determination (e.g., here and here).